Calculating P values from data.
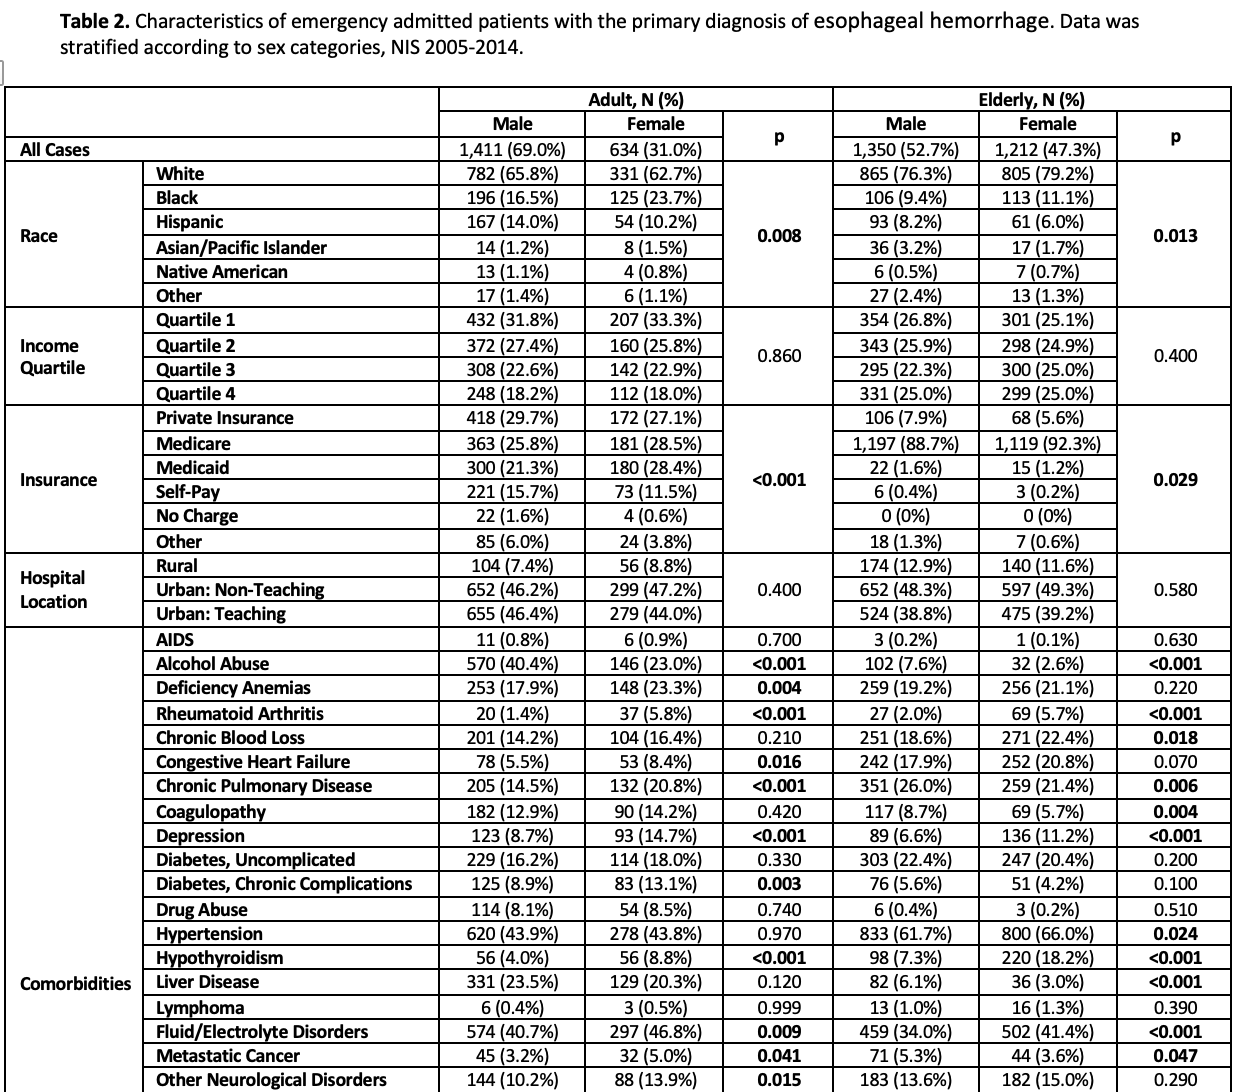
Below is a data set from admitted patients with the primary diagnosis of esophageal hemorrhage. Data was stratified according to sex categories.
I have a very similar data set for which I must figure out the P values. Therefore I am trying to understand and replicate the P values for the data set below before delving into my own project.
Now for my question:) Given the data below, how was the P value calculated in the race category?
How was the P value calculated for patients with AIDs (under the comorbidities category)?
How was the P value calculated for the "Age in years" category?
Important note: I am interested in which scoring test was used (T-test, Z-score, Chi-squared i.e) and how the P value can be calculated by using the internet. (It would be greatly appreciated if you can tell me how to obtain P values from the data that I provided through google sheets or SPSS software)
And again, I understand that the P-values were already calculated. I just want to replicate the data and understand. Thank you so much for your help.
Here is the age in year category-
MEAN (SD) MEAN (SD) P MEAN (SD) MEAN (SD) P
Age, Years- 49.75 (10.33) 50.88 (9.98) 0.021 77.65 (7.61) 79.97 (8.07) <0.001
Answer
- The questioner was satisfied with and accepted the answer, or
- The answer was evaluated as being 100% correct by the judge.
2 Attachments
- answered
- 1732 views
- $15.00
Related Questions
- Conditional mean and variance for joint PDF
- Goalscorer Probability question
- real analysis
- A lower bound for an exponential series
- Card riffle shuffling
- Prove that convergence of the infinite series of integral of absolue values of a sequence of functions implies convergence
- Explain how the binomial probability equation is $\frac{n!}{x!(n-x)!}(p^x)(q^x)$
- Uniform convergence of functions

What are the hypotheses being tested?
Thank you so much for answering my question. I know I already submitted my question and got the answer I was looking for, but I just discovered this other small segment to the chart on which I have a question. Could you provide a brief explanation for what scoring test was used? MEAN (SD) MEAN (SD) (p) MEAN (SD) MEAN (SD) (p) Age in Years 49.75 (10.33) 50.88 (9.98) 0.021 77.65 (7.61) 79.97 (8.07) <0.001
I think you should open a new question with a new bounty if you have another question