Times series Analys
I have a dataset with hourly power prices from 2022-2023. Additionally there is a power consumption forecast for every hour and a forecast for the weather in celsius. I am looking for advice to analyze this dataset and look for trends in it to forecast the price.
How would you explore the data? Which statistical methods would you use? Can you maybe explain what steps you would take in order to find trends, correlations or other things in the dataset?
I am exploring the dataset in R.
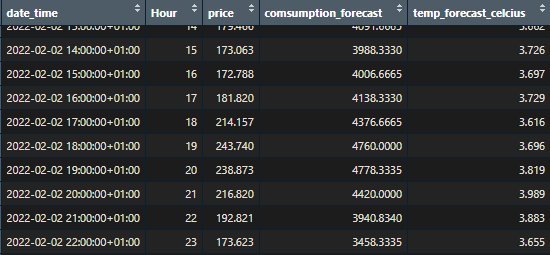
I have attached a picture of the first line in the dataset, so you can gain a sense of it.
Answer
- The questioner was satisfied with and accepted the answer, or
- The answer was evaluated as being 100% correct by the judge.
1 Attachment
-
Thanks for the response. I have a problem with implementing the ts command, as I can't define the date as hours ect. It says day() command not found. Do you know what could be wrong? I have the same packages
-
If I change the day command to yday() or mday() it works, but the x axes (time) is only going to 2400. So it feels like it just multiplies the frequency of 24 by 100. While it should be 8700 hours ish, as its a whole year.
-
No worries. You might need to convert date and time column to a datetime object using data.table setDT(data)[, datetime := as.POSIXct(datetime)]
-
Also, see the links I provided, those will help you for sure :-)
-
Thanks man, I will check them out. Are you an expert in this field? I might make another more advanced question
-
Of course, man! I would not call myself an expert, but I work with data a lot. I am an engineer and all I do is working with various data types. Let me know when you would want to ask the new question so I can reserve it immediately once I see it and determine I can solve it, if you want me to answer for you, as others can reserve it when you post it.
-
-
Surely will comment on here before
-
Thanks. Would it be today or tomorrow?
-
-
Probably in a few days when I have tried working through this with ur guidelines above
-
Sounds good.
-
- answered
- 1328 views
- $19.50
Related Questions
- Confidence Interval,Standard Deviation,Mean
- Very quick question - which statistical test to use?
- Probability and Statistics problem
- Compute the cumulative density function of X
- Choosing the right statistical tests and how to organize the data accourdingly (student research project)
- Explain how the mean of discrete variables is $\mu = \sum[x P(x)]$
- Probabilities/ states question
- Probabilty question

This wiyld require back and forth to discuss methods and potential questions. I would suggest increasing the bounty to $60 because we are not going to be done until you are totally satisfied and out of questions, comments or concerns.
Is it against the rules to discuss on discord ect? Because I would increase the bounty to 100$ if it was possible to screenshare and discuss models ect. It is hard to do so on a chat like this.