reading the output of a r regression analysis
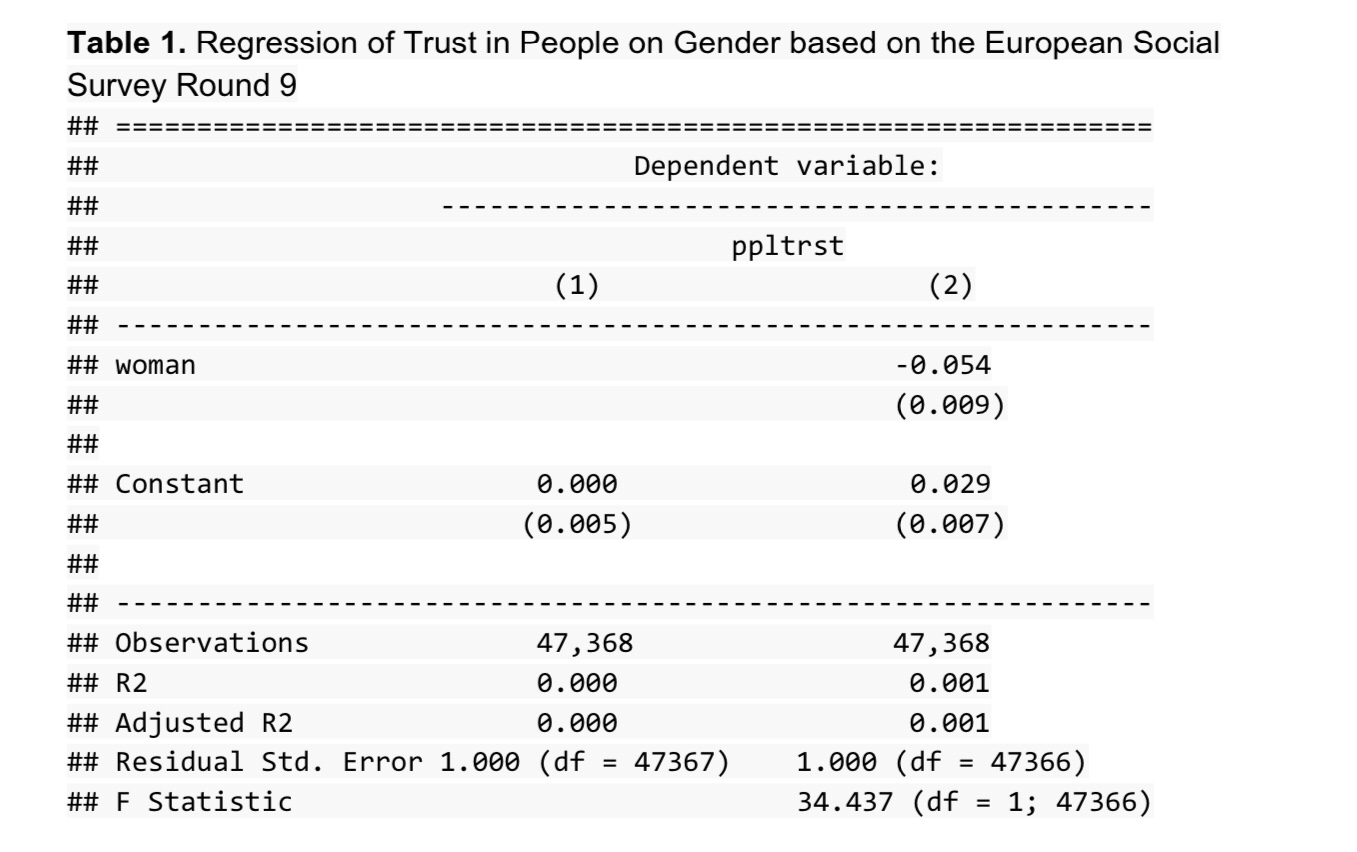
please refer to attached image for the regression table.
the questions are as follows:
1) How much does gender influence the trust in people according to the regression output in Table 1?
2) What is the t-value of the coefficient of gender in Table 1?
3) Is the coefficient of gender in Table 1 significantly different from zero? Tip: Do not gaze for stars.
4) Is women’s trust in people larger or smaller than zero according to the regression output in Table 1?
Answer
Answers can only be viewed under the following conditions:
- The questioner was satisfied with and accepted the answer, or
- The answer was evaluated as being 100% correct by the judge.
47
-
Small adjustment to answer to Q4: The regression equation is TRUST = CONSTANT + (-0.054)WOMAN
The answer is accepted.
Join Matchmaticians Affiliate Marketing
Program to earn up to a 50% commission on every question that your affiliated users ask or answer.
