One Way Anova
I am a university student in statistics and need help.
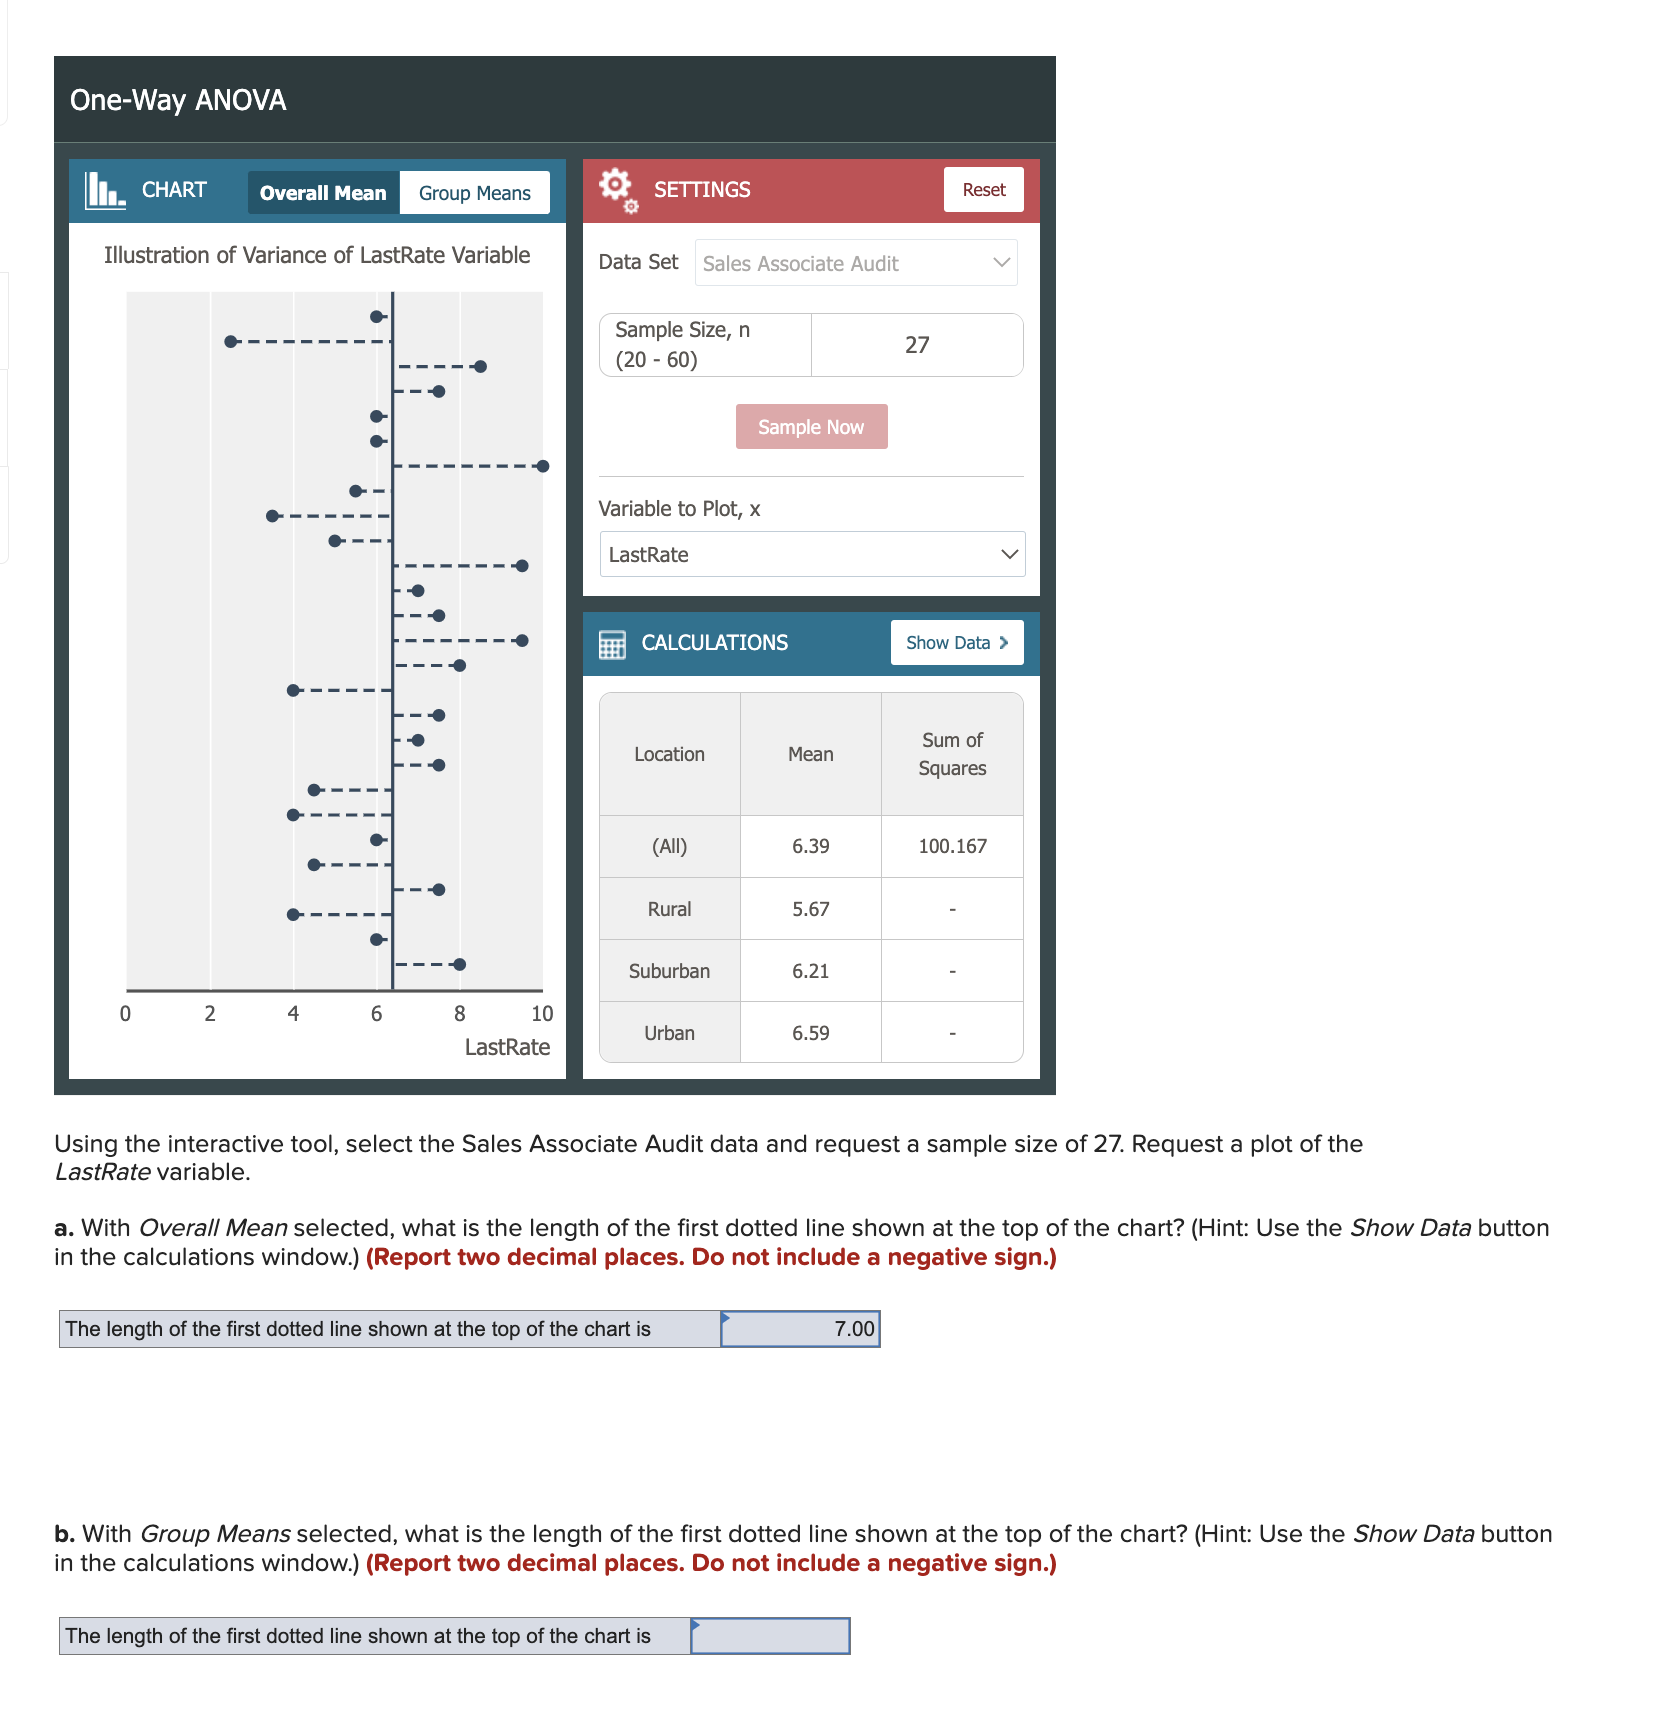
Please see attached problem from my homework.
7

Answer
Answers can only be viewed under the following conditions:
- The questioner was satisfied with and accepted the answer, or
- The answer was evaluated as being 100% correct by the judge.
363
-
To give a more precise answer, I need screenshots with "Show data" and with "Group means" selected. But you might figure it out with the given answer.
The answer is accepted.
Join Matchmaticians Affiliate Marketing
Program to earn up to a 50% commission on every question that your affiliated users ask or answer.
- answered
- 1206 views
- $15.00
Related Questions
- How do we define this choice function using mathematical notation?
- Car accidents and the Poisson distribution
- In immediate need of getting a statistics paper done!!
- How to simplify this expression? (statistics)
- Probability and Statistics question please help
- How do I meaningfully display Kruskal Wallis Data when I have a lot of zeroes?
- Help with statistics
- Choosing the right statistical tests and how to organize the data accourdingly (student research project)
