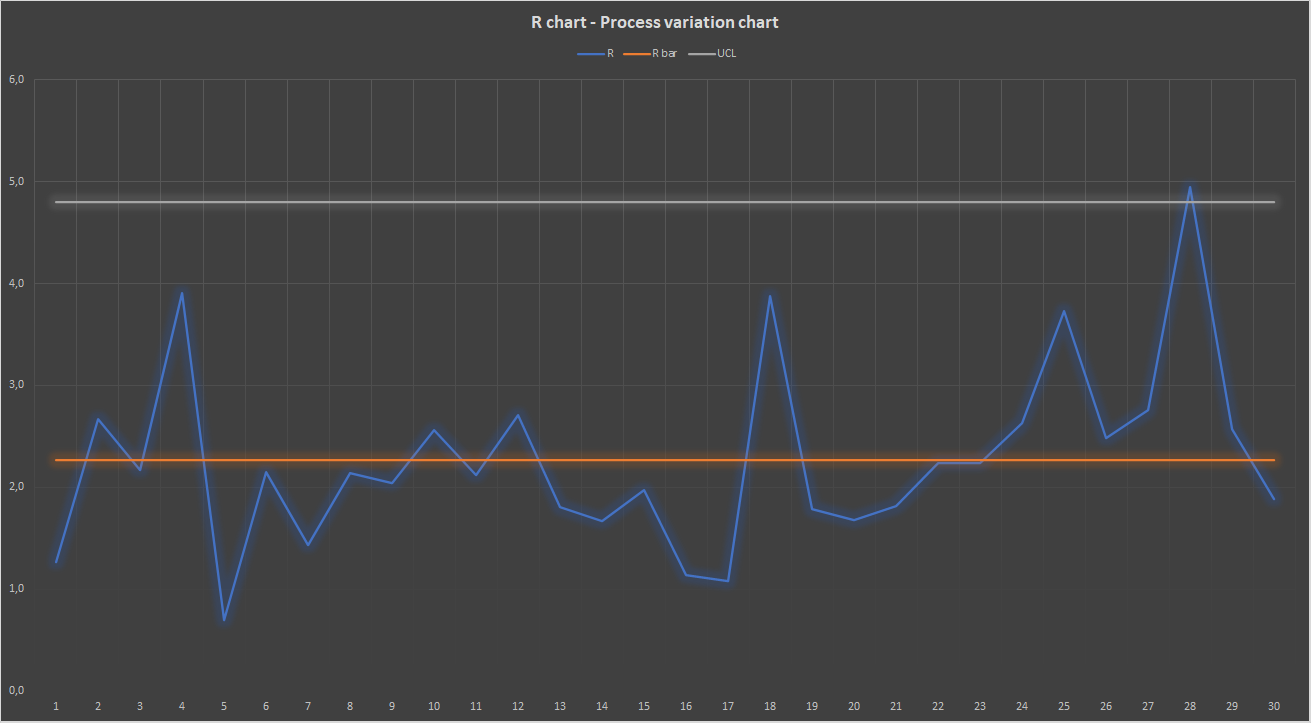
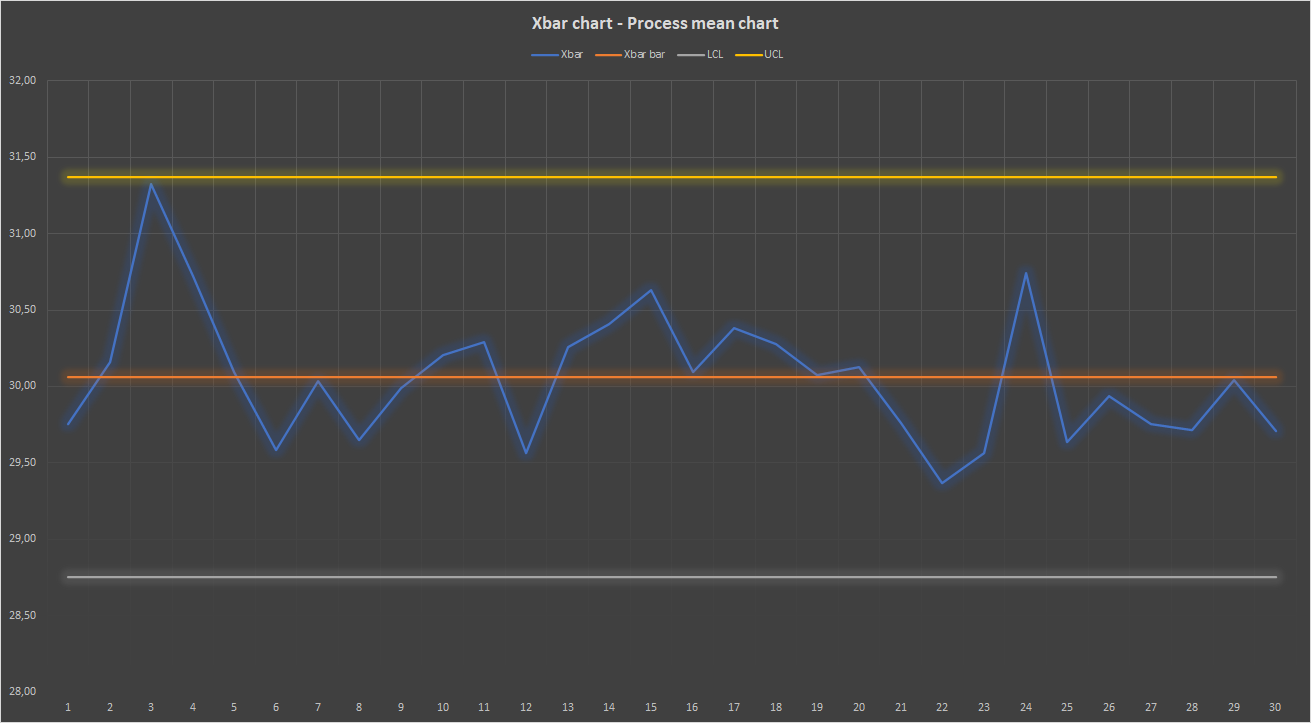
Writing a conclusion about data shown in Xbar and R control charts
The exercise gives you 30 groups of 5 numbers each. You have to build a table indicating the Xbar, Xbar bar, R, Rbar, LCLx, UCLx and UCLr. Next thing is to plot the two graphs. I don't know the exact translation (I'm from Brazil) but they seem to be called x̅ and R charts. One of them is a graph consisting in 4 variables: Xbar, Xbar bar, LCL and UCL. The another one consists in 3: R, Rbar and UCL.
Last thing in the exercise is to write a conclusion about the graphs. There's no background to data, it represents a random process somewhere. I'm pretty sure I got the table and the graphs right because it's because just formulas, but I need a trusted conclusion about them. Both graphs show the same process so it's only one conclusion.
To clarify: the question is only about reading the graphs and writing a conclusion (3-4 lines, really basic), I explained the rest as context.
Answer
- The questioner was satisfied with and accepted the answer, or
- The answer was evaluated as being 100% correct by the judge.
-
Thank you for your answer and specially for pointing that out on 28! I wouldn't have realized it on my own.
- answered
- 1813 views
- $2.95

Low bounty!
I thought it was two or three minute work for someone who knows... What do you suggest as a bounty?
This is not my area of expertise, but I am sure it would take way more than 2-3 minutes to understand this problem and write a good conclusion. Offer whatever you think is fair, hopefully it will get answered by someone else.