Can someone explain why the attached R-Studio Code, provided by the author, does not create the output like in his book?
Hello,
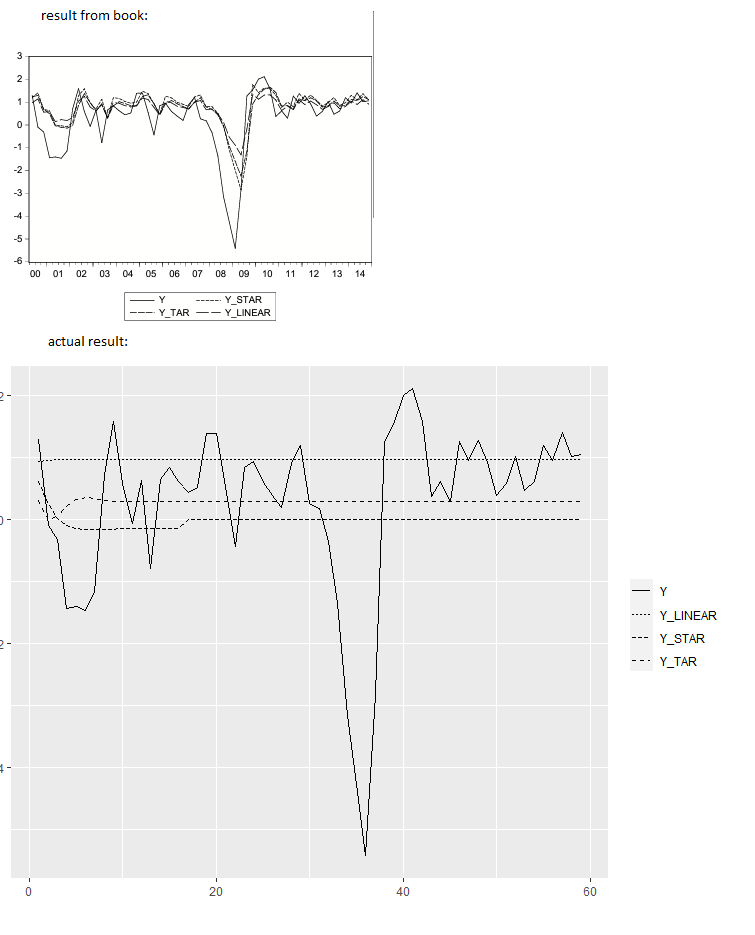
in Chapter 9.9 in the "Book Applied Economic Forecasting Using Time Series Method" by Ghysels, the US industrial production growth is modeled and forecasted using three different models in R-Studio. The result ist presented in the book. The R-Skript is provided by the author. However, every time I try running the skript by myself, I recieve a different result compared to the author. I tried a lot and I dont know what I am doing wrong, since I use the same code.
I would kindly ask to check the R-Code and give me an answer why the forecast differs from the one in the book, even though it should be the correct code, since it is provided by the author.
Thank you very much!
The data, code and results are attached.
12

Answer
Answers can only be viewed under the following conditions:
- The questioner was satisfied with and accepted the answer, or
- The answer was evaluated as being 100% correct by the judge.
3.7K
The answer is accepted.
Join Matchmaticians Affiliate Marketing
Program to earn up to a 50% commission on every question that your affiliated users ask or answer.
- answered
- 2616 views
- $50.00
Related Questions
- Populace Model
- Explain how to get the vertical values when $n = 10$, $p = .5$, $\mu = 5$ and $\sigma^2 = 2.5$
- Proper Test Selection for Repeated Interval Data Collection?
- Probability of drawing a red ball, given that the first ball drawn was blue?
- ANCOVA: R Squared and Partial Eta Squared
- Classification problem using one or more Simple Linear Perceptron
- Multivariate Student-t Posterior Predictive - Detailed Derivation
- statistics- data analysis

The tested models are AR, TAR, STAR