[Year 12 Trigonometric Functions] Research assignment investigation, using tidal waves to model data.
BACKROUND INFO: (Answer from question a)
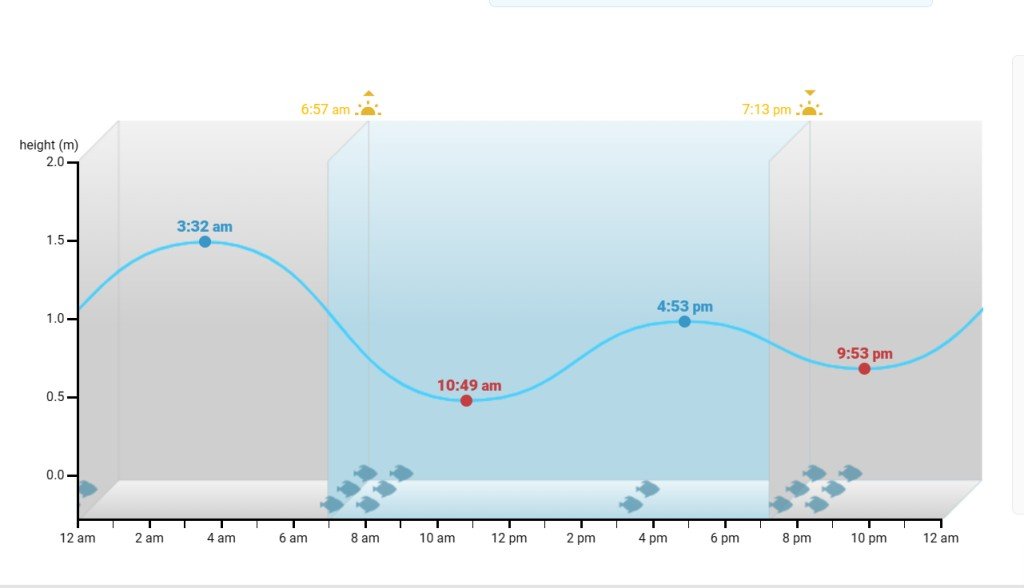
Tidal waves such as the one below do not really follow a normal trigonometric graph of the form $y= k cos at+ c$

So the behaviour of the data instead that prevents us from using the trigonometric function above is that: cos is a periodic function, the graph provided is not. And the maximum and minimums are not the same for each period.
Now,
b) Use graphing software to investigate graphs in the form $y=ksin(at+θ) + lsin(bt+θ)+c$. Explain briefly why these graphs may better model the data that you see. (3 marks worth)
c) Using the graph provided above, come up with an equation in the form $y=ksin(at+θ) + lsin(bt+θ)+c$ that models the data more closely than the standard trigonometric function. (use graphing software again here) (5 marks worth)
Tidal waves such as the one below do not really follow a normal trigonometric graph of the form $y= k cos at+ c$

So the behaviour of the data instead that prevents us from using the trigonometric function above is that: cos is a periodic function, the graph provided is not. And the maximum and minimums are not the same for each period.
Now,
b) Use graphing software to investigate graphs in the form $y=ksin(at+θ) + lsin(bt+θ)+c$. Explain briefly why these graphs may better model the data that you see. (3 marks worth)
c) Using the graph provided above, come up with an equation in the form $y=ksin(at+θ) + lsin(bt+θ)+c$ that models the data more closely than the standard trigonometric function. (use graphing software again here) (5 marks worth)
 Alice Verin
27
Answer
Answers can only be viewed under the following conditions:
- The questioner was satisfied with and accepted the answer, or
- The answer was evaluated as being 100% correct by the judge.
 Kav10
Kav10
2.1K
The answer is accepted.
Join Matchmaticians Affiliate Marketing
Program to earn up to a 50% commission on every question that your affiliated users ask or answer.
- answered
- 1394 views
- $19.00
Related Questions
- Confused on this graph question, not sure how to reduce it to linear and It looks too wonky to draw a best fit line, probably won't take long
- Is $\sum_{i=1}^{\infty}\arctan (\frac{n+1}{n^2+5})$ convergent or divergent?
- Rose curve
- Understanding Cylindrical Warping Equations and Derivation
- Trigonometry sin cot CAST
- Make a 2D polygon - but all the side lengths (bar one) are whole numbers, and all angles are multiples of 22.5
- Sinusoidal function question help
- Evaluate $\int \sin x \sqrt{1+\cos x} dx$

Very low bounty!
This takes at least an hour and a half work, so $90+ bounty!
Here I will add 20$, that is the most I can do. I am really sorry.
I don't have that much money unfortunately
the bounty is too low for the amount of work needed
I'm sorry could someone at least do part of it, so I know how to start it? Unfortunately I am unable to add to the bounty at the current time.
Would helping you with what to do work? The bounty is too low for doing the work.
Yes, any advice at all is welcome.