Choosing the right statistical tests and how to organize the data accourdingly (student research project)
Hi all!
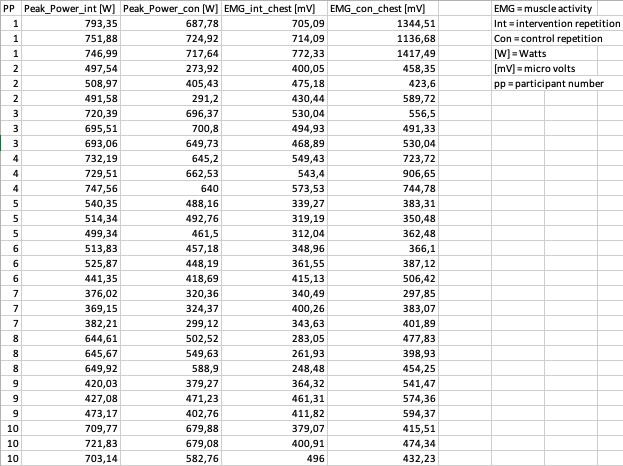
This is my first time using this website so I apologize in advance for any mistakes. Accordingly, I have no idea if I have offered the right amount of money. Let me know if it’s too low (or too high). I would really love some help with choosing the right statistics for my research project for my masters degree. It has been a couple of years since our last statistics course… I program in Matlab and I use SPSS for the statistics. I have attached a (sample) data set to this question (as a screenshot, I couldn’t upload an excel file). For the sake of this question assume normality and sphericity of data.
I will now explain the relevant parts of my experiment. I had one group of (17) persons. Each person performed a bench press protocol. The bench press protocol consisted of 3 intervention (‘INT’) reps and 3 control( ‘CON’) reps. During the repetitions we measured the (peak) power and the muscle activity.
I want to compare the peak power values and the muscle activity of the intervention reps against the control reps. I want to compare it at group level but I also want to be able to say something about each individual (to be able to classify responders and non-responders, which is a phenomena for this specific area of research).
I thought of using a paired samples T-test. I would then put all INT_peakpower in 1 column and all CON_peakpower in another column and compare them (and vice versa for muscle activity). I also thought about averaging the values for each person (so each person gets 2 values, 1 INT_peakpower and 1 CON_peakpower) and then performing a paired samples T-test. However, I thought that both methods undermine the power of me having done 3 measurements per person…
I didn’t think a repeated measures ANOVA would work because both repetition types have 3 measurements. Maybe a 2x3 ANOVA (2 types of repetition and 3 repetitions) but I’m not sure how that works.
All in all, how can I best analyze my data set and how do I need to arrange the data accordingly?
Thanks you so much in advance!
Answer
- The questioner was satisfied with and accepted the answer, or
- The answer was evaluated as being 100% correct by the judge.
- answered
- 2669 views
- $20.00
Related Questions
- Explain how to get the vertical values when $n = 10$, $p = .5$, $\mu = 5$ and $\sigma^2 = 2.5$
- Bayesian Statistics - Zero Inflated Binomial Model - Calculate Posterior Conditional Distribution
- Statistics tasks
- CLT and probability
- Times series Analys
- Bivariate Normality questions
- Webull problem
- Estimating the Suit with 12 Cards: MLE and Confidence Intervals in a Figgie Starting Hand

This is not my area of expertise, but the offered bounty seems low. Think about how much time one may need to spend to write a good solution and what a fair hourly rate for such individual would be. That would give you a pretty good idea to decide on a fair bounty.
Thanks for the info. I doubled the bounty.