Chi square test for association in Jamovi in inferential statistics
I am writing a paper about word formation processes (derivation, compounding, conversion, shortening) used in a novel. I had to read the novel and count how often each word formation process was used and figure out which formation processes was used most often. Now I have to do a chi-square test of association (according to my teacher) in Jamovi and should get a p-value to figure out whether my hypothesis (H1: derivation is the most commonly used word formation process in this novel) can be accepted or denied. However, I don't know how to correctly insert my data into Jamovi to get a p-value and which options to choose in Jamovi. If anyone could guide me through that process I would be really greatful. I will also attach a picture of my dataset it that helps! I don't know how this website works since im using it for the first time but if you have any question and can contact me in any way please do so! I would be really greatful for any help :)


Answer
- The questioner was satisfied with and accepted the answer, or
- The answer was evaluated as being 100% correct by the judge.
-
Hi! Thank you for replying! I think my problem is with the data insertion. I dont know what you mean by frequency. I only have the count (e.g. 2730 words were formed by derivation(i also added a file with my data)) and the percentage. idk whether you can reply to my comment but would it be possible to maybe send a screenshot of how the data should be inserted in jamovi? i could send you all the information you need and i would also tip you 10 i was trying for an hour and i still dont get it lmao
-
That is OK. I can explain it more for you. I do not have Jamovi installed so wouldn’t be able to send you a screenshot of the software page. Would that work?
-
-
yeah sure! maybe you could send me a screenshot of the excel datasheet in the way it should be layed out. i could also send you a screenshot of jamovi if i still dont understand so you could tell me what to do. so will you just edit the answer and insert it there?
-
Let me send you more explanations first, if it does not work for you, we can do more. Give me some time so I get home and write more explanations.
-
-
thank you so much!
-
See the updated answer. Hopefully, this will work for you. Let me know.
-
-
sorry i can imagine its really annoying that i still dont seem to get it but is the frquency count just the percentage or something else? and then would it still be only two columns? so word formation process and the frequency count?
-
Don’t worry. I noticed I did not add the link at the end. Now, it is there. It has step by step screenshots in Jamovi. Please follow that and let me know.
-
-
could you maybe check file 3 that i just uploaded and tell me if that makes any sense?
-
Not quite right. See the updated note in my answer. I think I figured what exactly your teacher is looking for.
-
-
See the updated answer. I think I figured what your teacher wants you to do.
-
I think you got it in Figure #5 :-)
-
Also, see this link for more explanation and details in Jamovi :-)
-
https://davidfoxcroft.github.io/lsj-book/10-Categorical-data-analysis.html
-
-
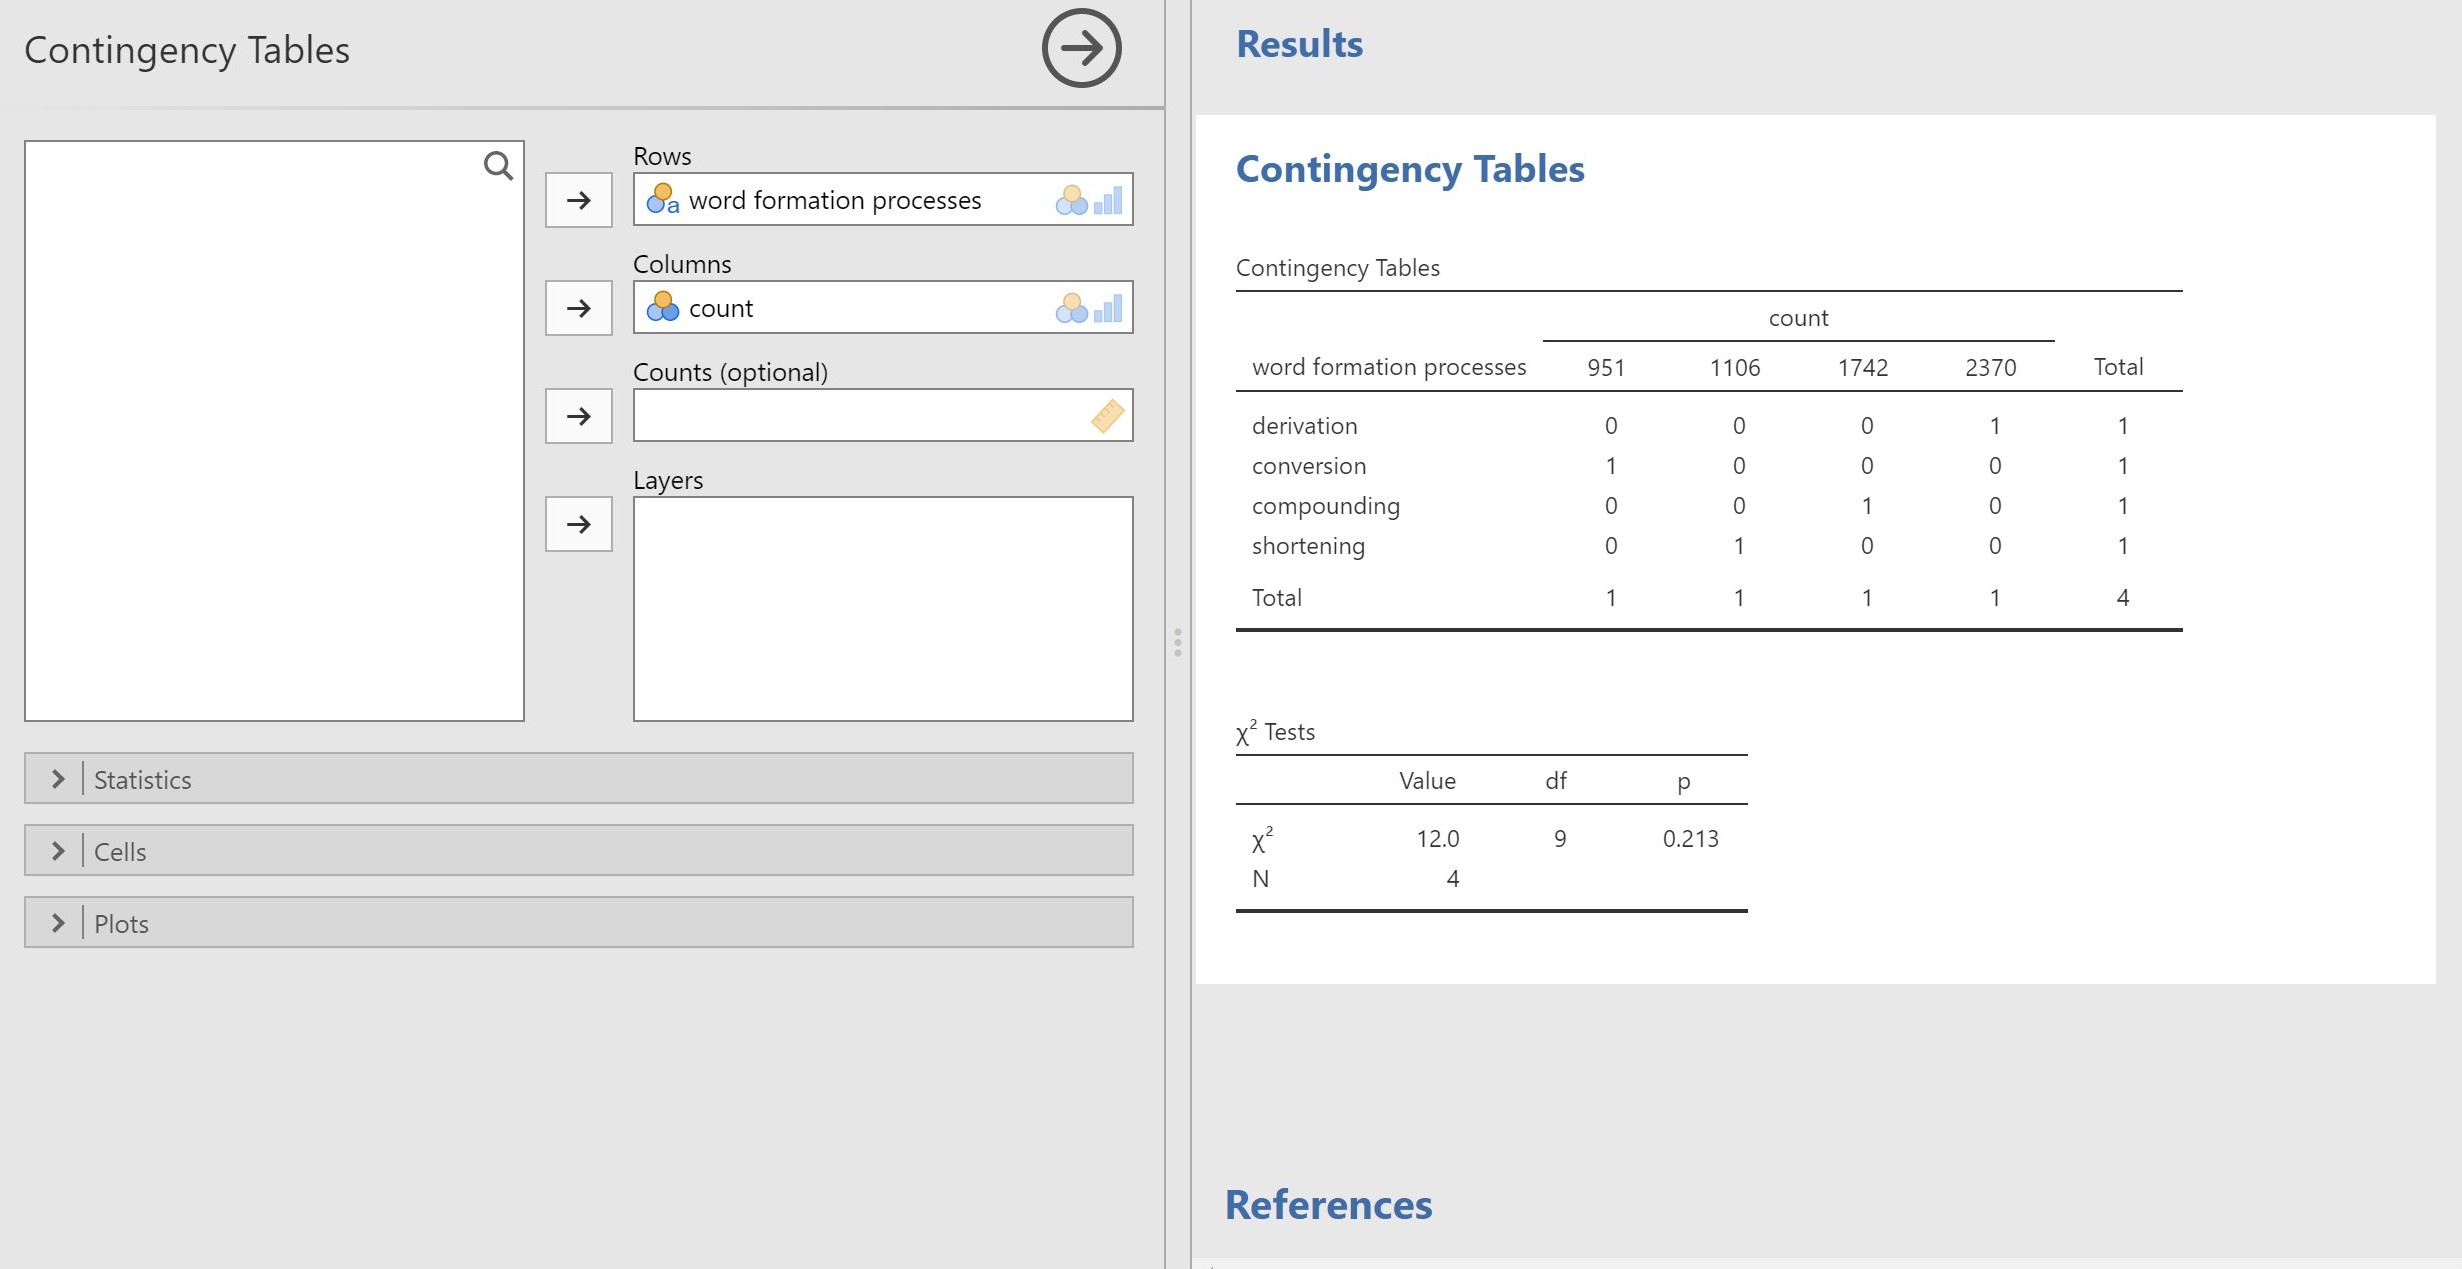
i uploaded a file 5 but i dont think the results make any sense oh god... im so sorry for taking up so much of your time. but the results in file 5 dont make any sense right?
-
See Figure 10.4 in the link I added above. Yours should look like that. You got most of it correct. It is just the count (frequency) should be a column and observed and expected counts for each type in the rows.
-
See Section 10.1.7 and Figure 10.4 in the link above.
-
-
no way figure 5 is correct lmaoo
-
It is mostly correct. Not completely ;-)
-
-
You are getting there.
-
Please tell me you got it similar to Figure 10.4.
-
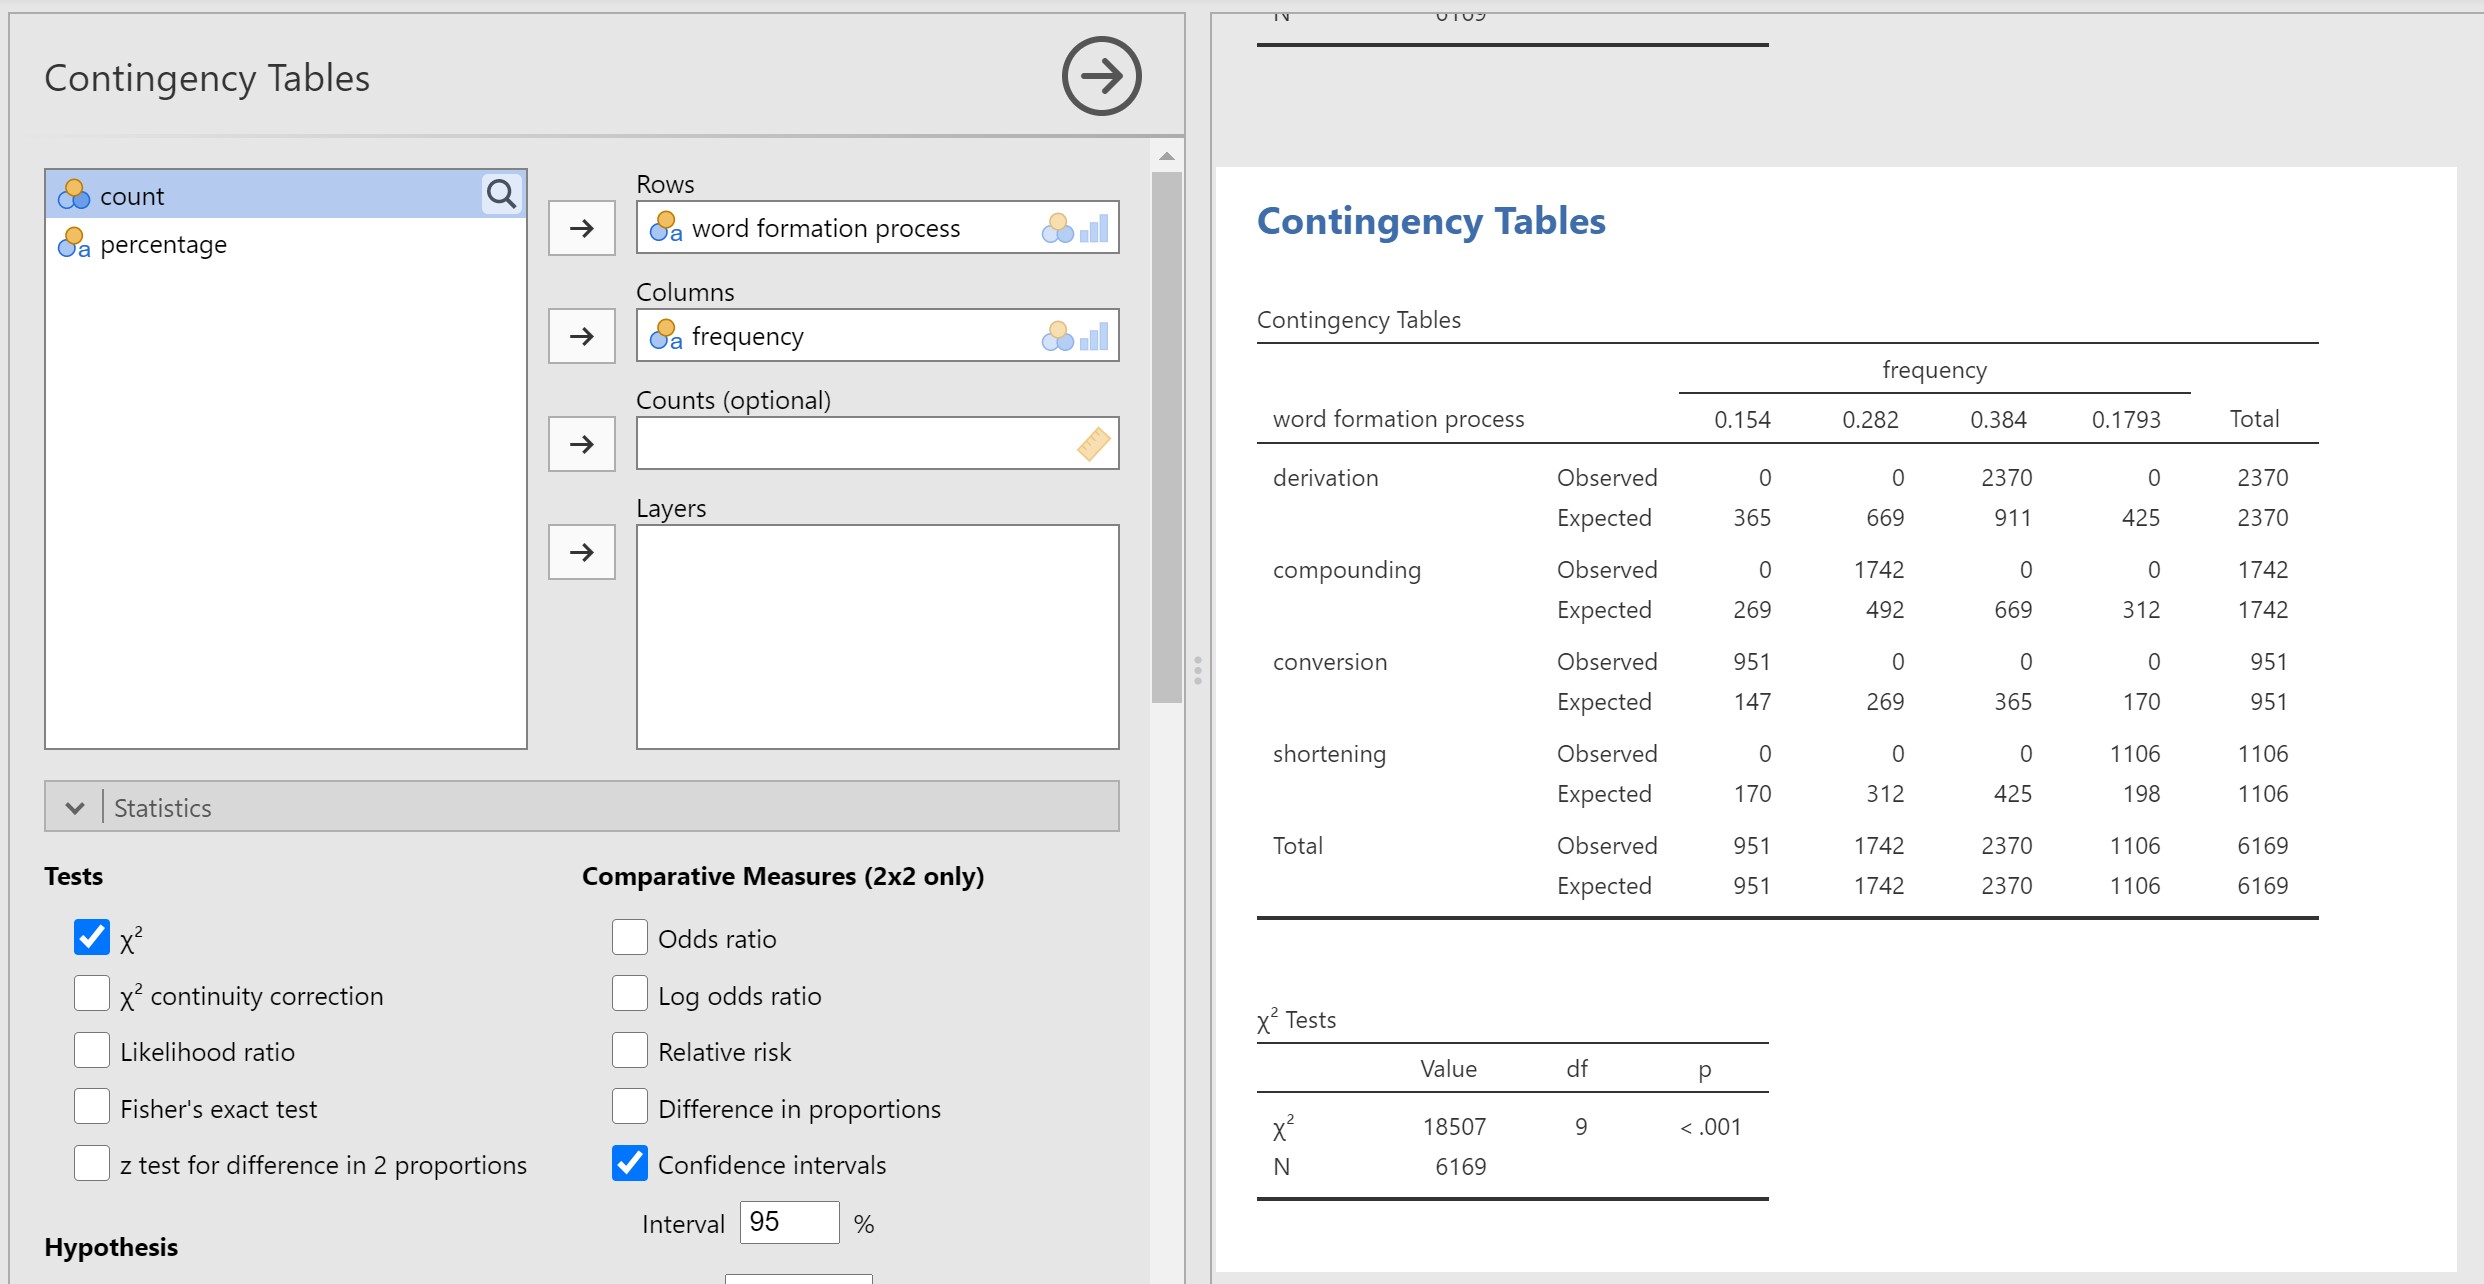
i uploaded file 6. do you mean like that?
-
No. You need to have the word formation types on the row. It should be exactly similar to the table I referred you to. Please see Figure 10.4 in the link above.
-
okay yeah but my instructer said that we have to use the test of association and not goodness of fit. also my hypothesis was not as extensive that i predicted the ratio between the word formation processes. thats why im a bit confused
-
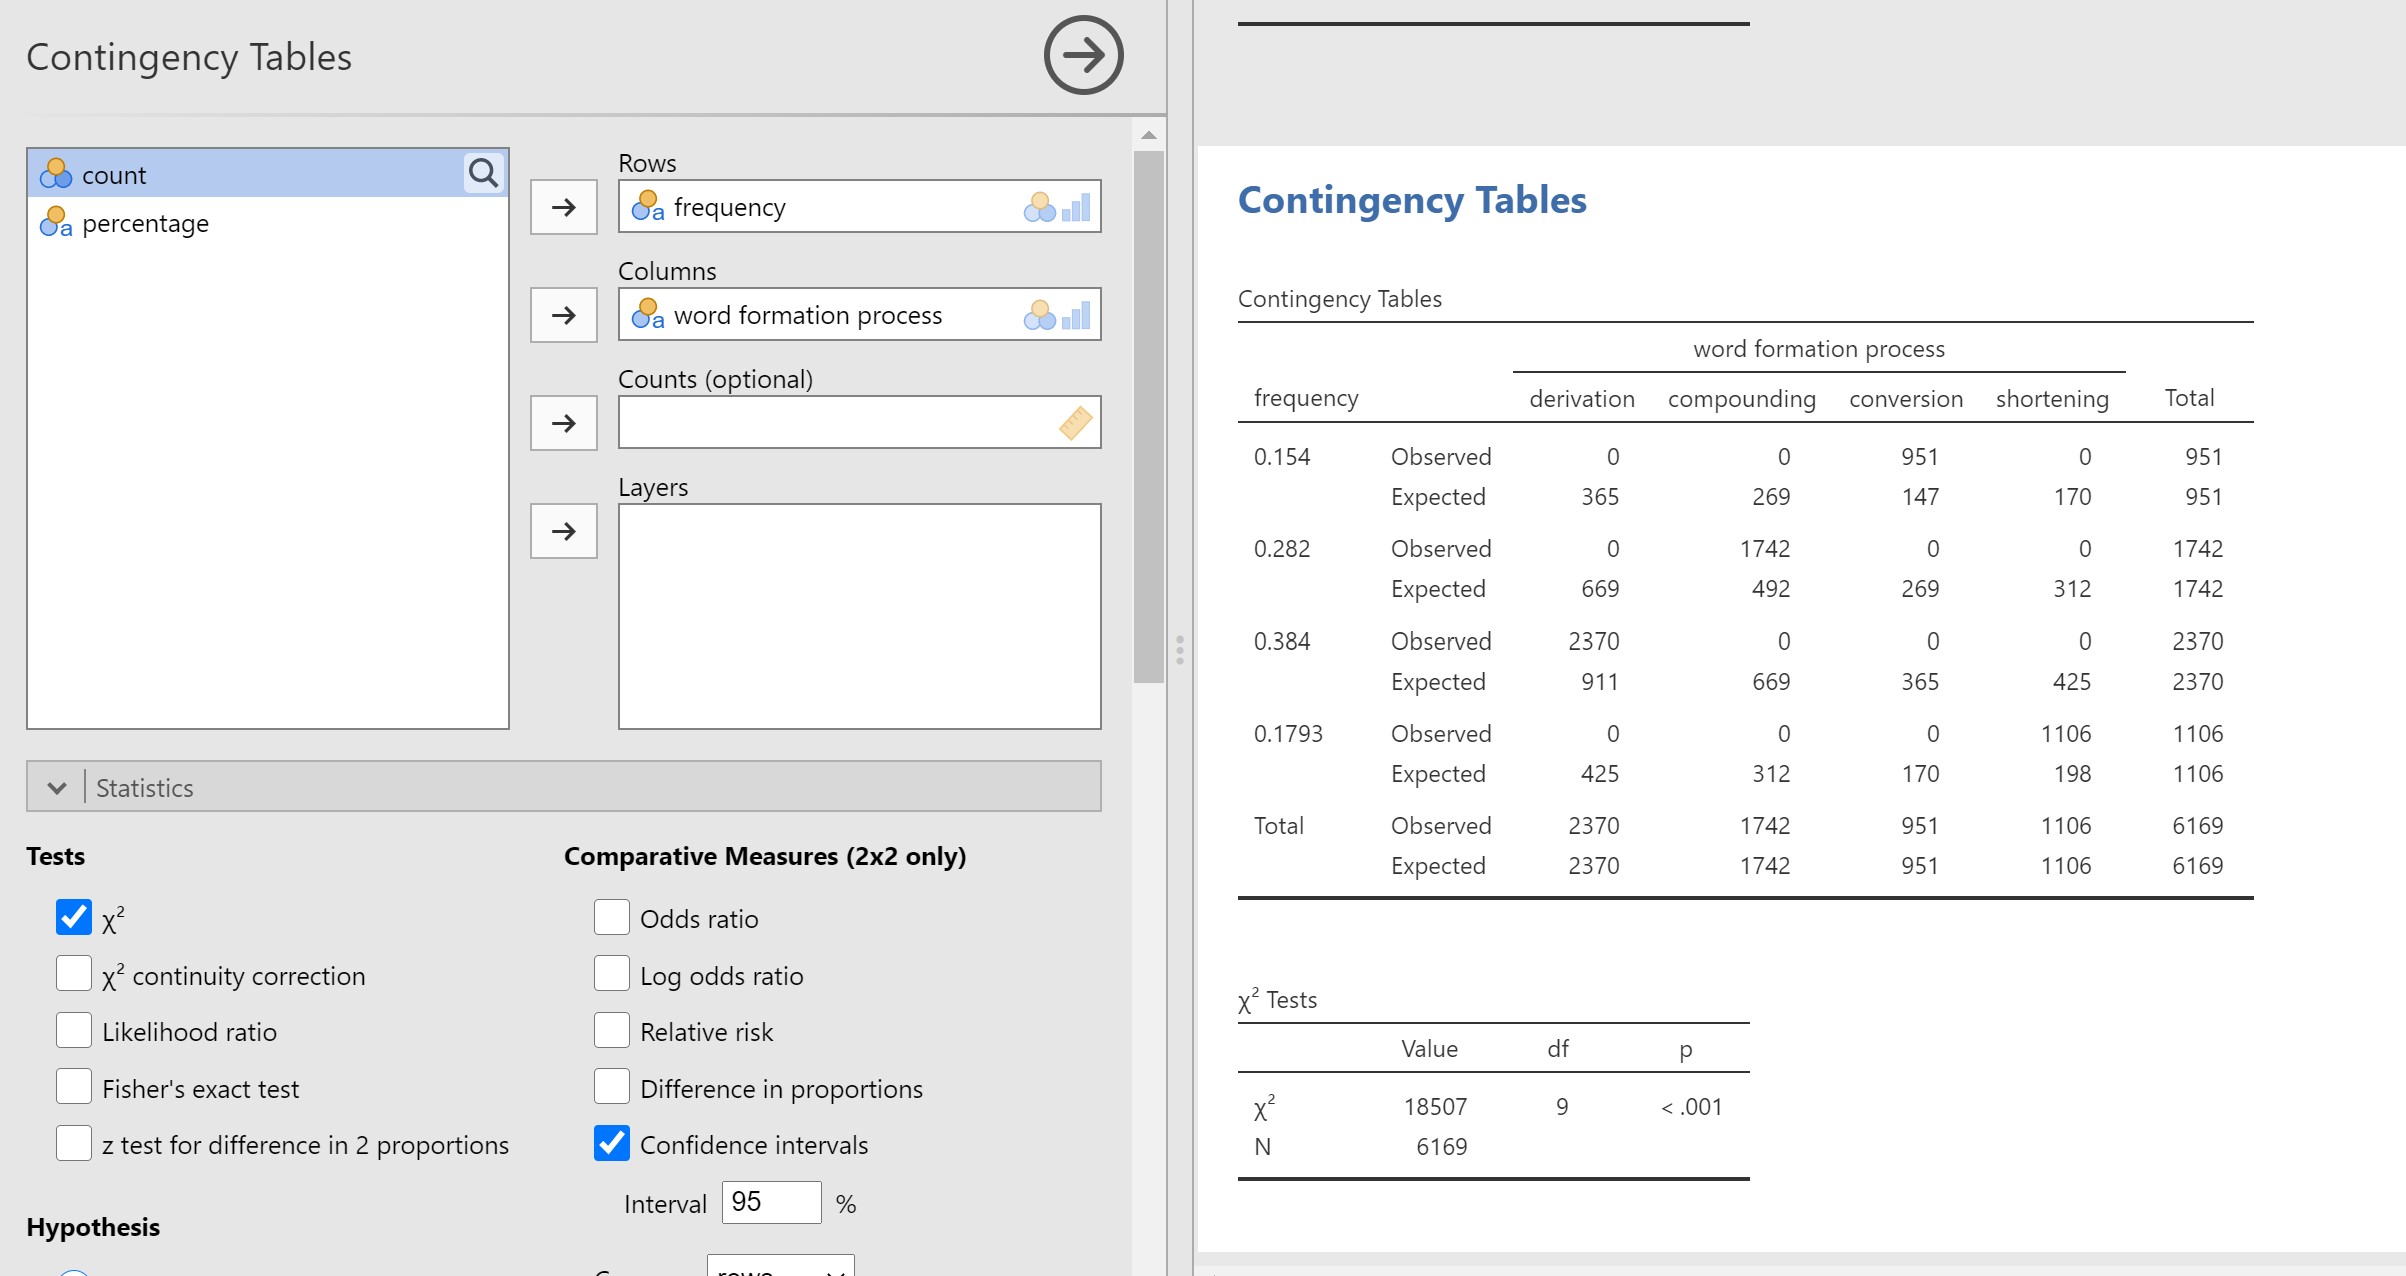
I did it the way it was in figure 10.4 and i think i finally did it right. again im so sorry for all the trouble and thank you so much for helping me :))
-
-
Sorry it was night time here and I fell asleep. I am glad that you got. Thanks for the tip :-)
- answered
- 1972 views
- $10.00
Related Questions
- Combinations of factors not observed, non-full rank design matrix. How to explain to investigator?
- Bayesian statistics
- Weighted average issue
- Estimating the Suit with 12 Cards: MLE and Confidence Intervals in a Figgie Starting Hand
- What statistical test should I use to compare 2 multiple linear regression models
- Can someone explain why the attached R-Studio Code, provided by the author, does not create the output like in his book?
- Probabilty question
- Finding the probability that a roughly normal distributed will have the highest value among multiple curves
