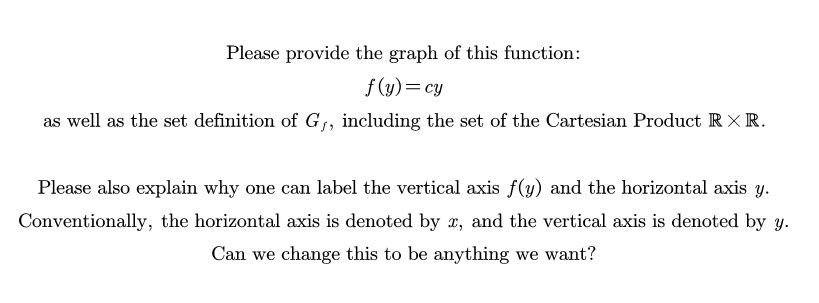
What is the graph of $f(y)=cy$?
Answer
- The questioner was satisfied with and accepted the answer, or
- The answer was evaluated as being 100% correct by the judge.
1 Attachment
-
Let me know if you need any clarifications.
-
Erdos, I appreciate the response. So in your example, did you set y=f(y). Or you just labeled the horizontal axis as f(y). In the set definition, wouldn't it be (y, f(y): y is in R) for the pairs?
-
I added some more details.
-
-
Great! One last thing . Suppose that the input is now x+y=u. Is this also valid: Graph of f = {(u,v) ∈ R×R : v = f(u)} is equal to {(x,y)∈R×R:y=f(x)}.
-
Your question does not make much sense. In the equation x+y=u there are three variables. You should have two variables in the equation of the graph of a function.
-
-
I am sorry about that. I hope I can clarify. What if we add two real values, x and y. Is it true that the addition of two real numbers = another real number. Then apply the function to that new variable which is composed of the addition of two real variables? Can we graph this new variable?
-
For example: f(x+y)=c(x+y).
-
In this case you can set z=x+y, and the equation can still be written as f(z)=cz. The graph will be the same. If you define f(x,y)=c(x+y) then this is a function of two variables x and y whose graph is a surface in three dimensions, but I think this is outside of the scope of your question.
-
-
Yes it would be. So then we would set up the graph to be the vertical axis as v and the horizontal axis as u. Therefore this statement would be true: Graph of f = {(u,v) ∈ R×R : v = f(u)}. I should have set that expression equal to another variable as there are only two variables in the equation of the graph of a function. I understand now.
- answered
- 1167 views
- $10.00
Related Questions
- Confused on this graph question, not sure how to reduce it to linear and It looks too wonky to draw a best fit line, probably won't take long
- piceiwise function, graph
- Using Substitution to Prove an Big O/upper bound is O(n^3)
- Find the x and y intercepts, the vertex and the axis of symmetry of the parabola with equation y = - x^2 - 2 x-1? Draw the parabola
- [Year 12 Trigonometric Functions] Research assignment investigation, using tidal waves to model data.
