Density plot
*Picture in File*
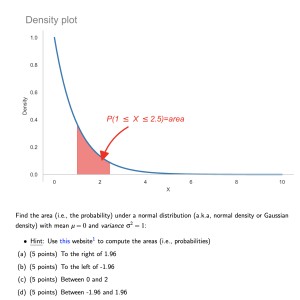
Find the area (i.e., the probability) under a normal distribution (a.k.a, normal density or Gaussian density) with mean μ =0 and variance σ2 =1:
(a) To the right of 1.96
(b) To the left of -1.96
(c) Between 0 and 2
(d) Between -1.96 and 1.96
 Evvee3355
32
Answer
Answers can only be viewed under the following conditions:
- The questioner was satisfied with and accepted the answer, or
- The answer was evaluated as being 100% correct by the judge.
4.8K
-
Please leave a comment if you need any clarifications.
The answer is accepted.
Join Matchmaticians Affiliate Marketing
Program to earn up to a 50% commission on every question that your affiliated users ask or answer.
- answered
- 1301 views
- $4.00
Related Questions
- please use statistics to explain spooky phenomenon
- Need help with negative proportions in experiment
- Introductory statistics, probability (standard distribution, binomial distribution)
- ARIMA model output
- Choosing the right statistical tests and how to organize the data accourdingly (student research project)
- Find a number for 𝛼 so f(x) is a valid probability density function
- Explain how the binomial probability equation is $\frac{n!}{x!(n-x)!}(p^x)(q^x)$
- reading the output of a r regression analysis


Can you provide the link for the website mentioned in the picture?
Sure https://homepage.divms.uiowa.edu/~mbognar/applets/normal.html